Table of Contents
Tips for Debugging Laravel Applications?
Introduction

Debugging is an integral part of software development. It is often associated with problem-solving but is also a useful tool during software development. Debugging is largely defined as the process of identifying where the code fails. It helps solve the bugs and errors found during the testing process.
Solutions developed with Laravel need to be debugged at times as well. Laravel has several built-in tools and techniques to assist with this process. This article provides several tips for debugging a Laravel code.
Tips For Laravel Debugging
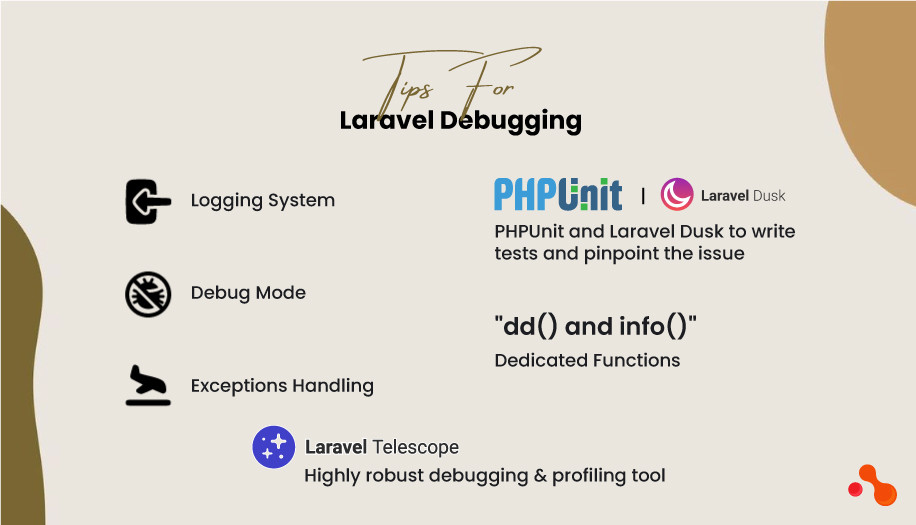
The robust logging system is a vital insight into the various execution stages and the application flow. It is possible to find your issue within the log or use it to pinpoint the issue. Eloquent ORM also allows generating a query log to inspect for errors or performance issues.
By enabling the "debug mode" in the Laravel environment file. This will display the error messages in detail in case the code breaks and displays the stack trace to find the issue.
It is easy to prevent errors by gracefully using exceptions to handle known scenarios.
URL routing issues can be detected by verifying that the routes and controllers are defined correctly and interact with the model views.
It allows the use of PHPUnit and Laravel Dusk to write tests and pinpoint the issue.
There are dedicated functions like "dd() and info()" to debug. A special package called Laraveldumps simplifies the process even more.
The Laravel Debug bar package provides more details about your application, such as the queries and routes. It is ideal for detecting ill-performing queries and code.
The Laravel Telescope package is a highly robust debugging and profiling tool to monitor the performance of an application in real-time.
The Laravel Log Viewer package is a graphical interface to view and filter your application log files and find errors or bugs.
Tools & Techniques To Debug
There are several packages one can use for the purpose of debugging. Laravel also has a few built-in functions for this purpose. Here is more information on some of them:
LaraDumps
This is the perfect tool for development, testing, or debugging. Activating LaraDumps will present the debugging information in a very nice manner. It is necessary to install this package before using it. The installation is relatively straightforward and can be achieved using several methods. One of the easiest ways to do so is with 'composer,' like:
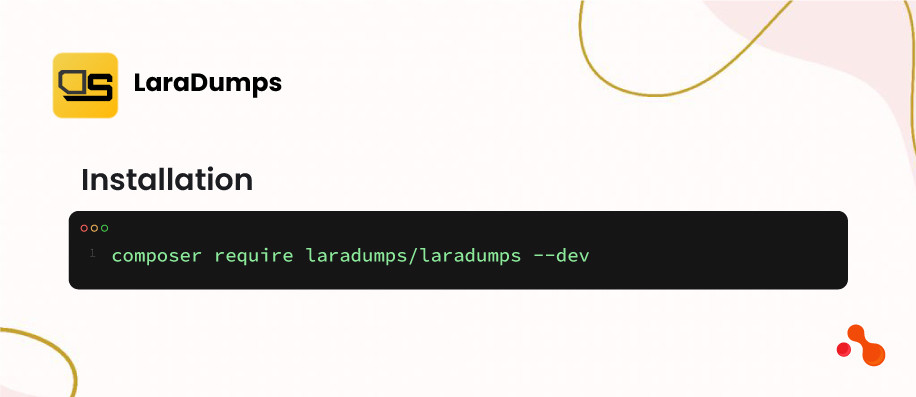
composer require laradumps/laradumps --dev
Some of the main features include:
Single or multiple variable dump.
View & search for the dumped values.
Use various screens for efficient debugging.
Ability to watch SQL queries, validate JSON
Monitor Laravel logs
Laravel Telescope
This is a versatile debugging assistant tool for debugging, profiling, and monitoring a Laravel application. It is an open-source package that can help you with the debugging process and improve the application's performance. It is simple to install this with the help of 'composer' like this:

composer require laravel/telescope
Debugging errors & exceptions.
Monitoring SQL queries
Track application performance & memory usage.
Analyze HTTP requests and responses.
Real-time insights.
Various 'Watchers' to monitor the application.
Laravel Log Viewer
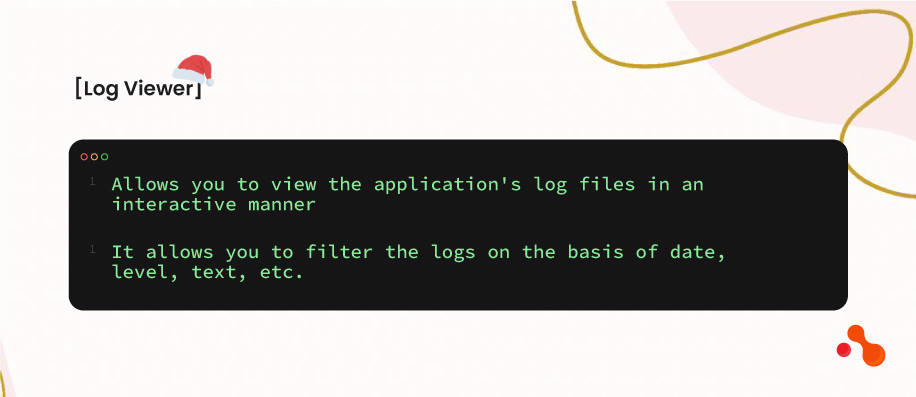
This is a simple package that, as the name suggests, allows you to view the application's log files in an interactive manner. It allows you to filter the logs on the basis of date, level, text, etc.
Laravel Debugbar
The Laravel Debugbar is a handy package designed to assist developers in debugging their Laravel applications. It is a package that integrates seamlessly into Laravel projects, providing a toolbar in the browser that displays various debug information about the application's performance, database queries, views, requests, and more.
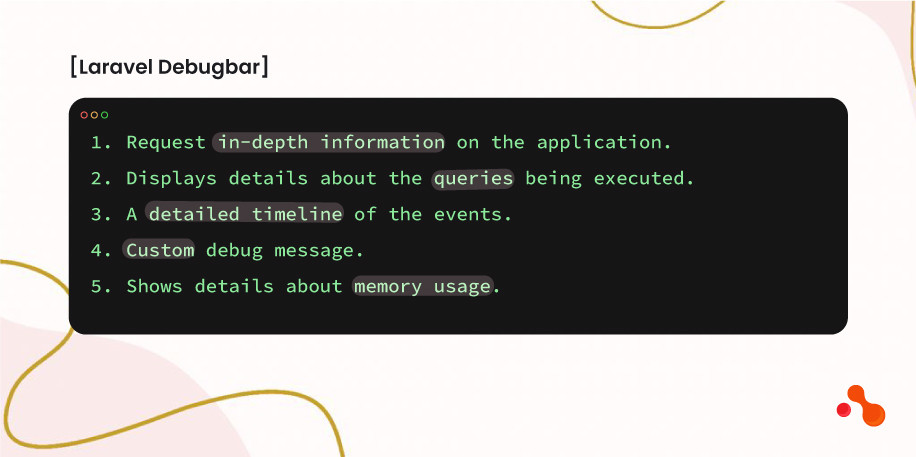
Some of the main features include:
Request in-depth information on the application.
Displays details about the queries being executed.
A detailed timeline of the events.
Custom debug message.
Shows details about memory usage.
Laravel Tinker
This is a REPL (read-eval-print loop) tool for Laravel. The way it works is that one can use the command line to interact with the application code and data. It is the ideal tool for the purpose of testing and debugging. Tinker is ideal for testing the logic, model's functions, and configuration. The added advantage is that it is not necessary to create a route or controller. Some of the other features include generating fake data, manipulating databases, run migrations, seeders, or factors.
Laravel Dusk
Laravel Dusk is an end-to-end testing tool specifically designed for Laravel applications. It allows developers to write and run browser automation tests to simulate user interactions with the application in a real browser environment. It can be installed as a composer package and is highly useful for debugging and troubleshooting your application. It is the best tool for debugging the front-end features. This includes elements like forms, links, menus, buttons, validations, and more.
Conclusion
Debugging is an essential technique to ensure the application your release is free from bugs. The good thing about Laravel is that it has several tools and packages to help with the debugging process and release flawless apps. It is good to implement a systematic approach for effective debugging. Start by reproducing the issue, narrowing down the scope of the problem, using debugging tools judiciously, and test solutions iteratively to track down and resolve issues in your Laravel application.
