Best Performance Bottleneck Monitoring Tools Developers Trust
Learn how performance bottleneck monitoring tools help businesses spot hidden issues before they crash your app. Fix lag, improve speed, and keep users happy—without the guesswork.

Acquaint Softtech
Introduction
When your app slows down—whether from a lagging API, heavy backend query, or unexpected traffic spike—it doesn’t just annoy users, it drives them away. And in most cases, you won’t even know until it's too late. That’s why modern businesses invest in performance bottleneck monitoring tools from day one!
Performance issues are not only a nuisance in today's high-speed digital world, but they also silently hinder growth. When a page takes just one extra second to load, it can cause a 7% drop in conversions and a 16% decline in customer satisfaction.
These aren’t just numbers—lost revenue, poor reviews, and user churn. And the worst part is that most bottlenecks don’t announce themselves. They lurk in slow APIs, under-optimized servers, or overlooked backend processes—waiting for your next traffic spike to expose the cracks.
Why Are Performance Bottlenecks a Business Risk?

Performance isn’t just about technical metrics—it directly impacts business results. Slow software not only weakens your brand but also slows down your business and creates long-term trust issues with users. Infact, businesses neglect performance bottlenecks, and they often go undetected until they start costing real money.
Here’s what the latest industry data tells:
🛑 Issue | 💥 Impact |
1 second delay in load time | -7% conversions, -16% drop in user satisfaction |
Slow site experience | 70% of users drop off without converting |
No real-time monitoring | Bottlenecks go unseen until customers complain |
API latency in DevOps workflows | Missed SLAs and broken deployment cycles |
With powerful performance bottleneck monitoring tools, business gain visibility into every failure point—be it slow database queries, inefficient server processes, or overloaded third-party services.
Resolve Hidden Performance Issues with Expert Diagnosis!
Identify exactly where your stack is failing with help from expert backend specialists at Acquaint Softtech. We’ll audit your APIs, databases, and infrastructure to uncover what’s slowing you down.
Core Capabilities to Expect from Modern Monitoring Tools
Whether you're managing APIs, microservices, or monolithic platforms, the right performance bottleneck monitoring tools help you stay ahead of system failures—without slowing your business down. Here are the core features that top software businesses expect when choosing tools to prevent system slowdowns—
1. Real-time tracking that captures real issues
Great monitoring tools deliver more than just metrics!
They provide continuous insights into system behavior—tracking CPU usage, memory leaks, load time, and server stress live. Businesses using real-time system monitoring tools can catch slowdowns before users experience them.
2. Clear, actionable root cause diagnosis
Slowness without clarity leads to guesswork!
Monitoring tools break down requests to identify whether the problem is in a slow database call, third-party service, or inefficient code path. These performance diagnostics tools help reduce MTTR (mean time to resolution) across all stacks.
3. End-to-end stack observability
Whether it’s front-end load, back-end congestion, or network latency, top software product engineering services demand tools that trace every request from user click to server response. This end-to-end visibility is essential for system performance optimization and scalability.
4. Threshold-based alerting and automation
A robust tool lets your business set precise performance thresholds!
If your backend takes longer than 300ms or your API crosses a 5% error rate, you get instant alerts. Integrating this with CI/CD and messaging platforms makes it easier to eliminate backend bottlenecks fast.
5. Deep inspection of APIs and database behavior
Most bottlenecks originate from slow APIs or poorly written SQL queries. The best tools track endpoint response times, query performance, and throughput—making them reliable APM tools for bottleneck detection in production-grade systems.
6. Easy integration into your workflow
No business wants another siloed dashboard!
Effective tools connect with platforms like GitHub, Slack, Datadog, and Grafana—ensuring visibility and alerts are part of your existing process. This is a must for businesses at any software product engineering company aiming to scale efficiently.
Choosing the right performance bottleneck monitoring tools isn’t about having flashy dashboards. It’s about helping your business detect, diagnose, and resolve real problems faster than ever.
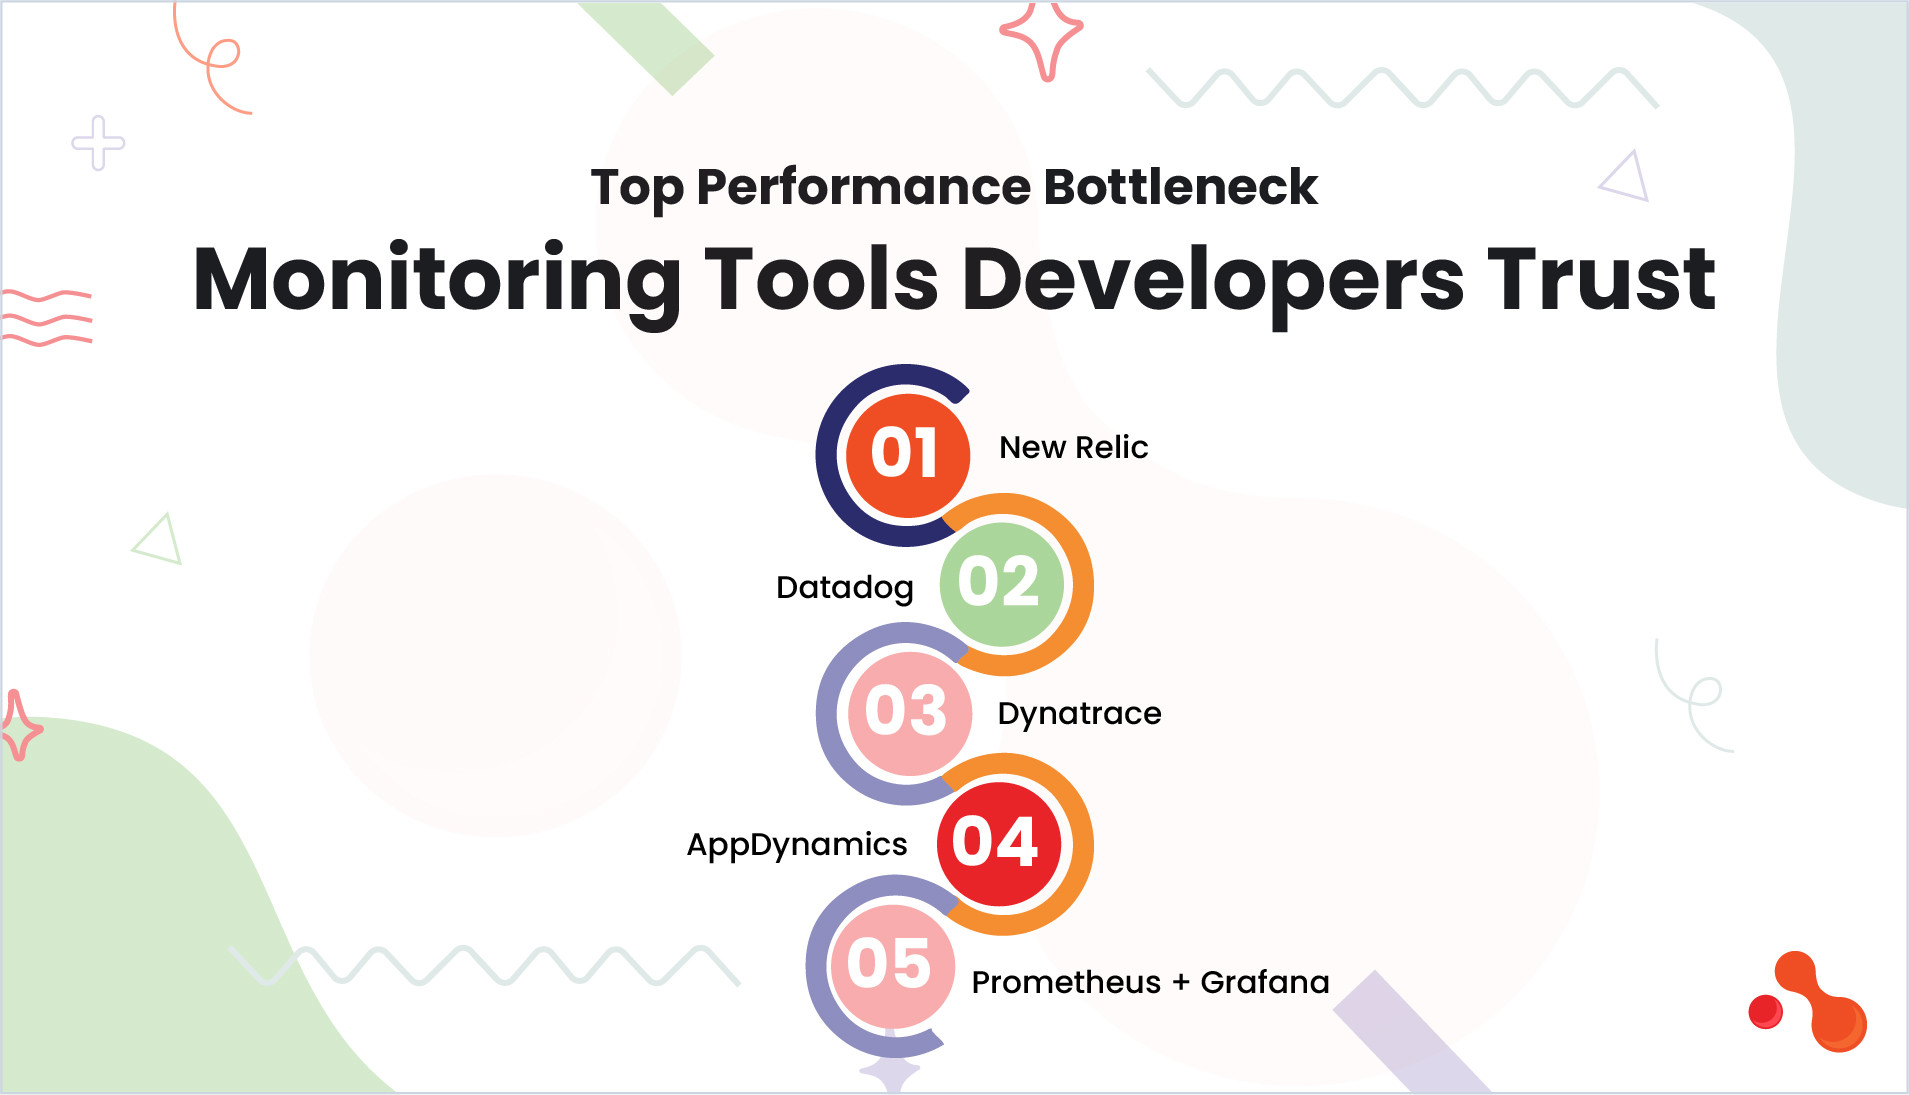
Top Performance Bottleneck Monitoring Tools Developers Trust

The best monitoring tools are trusted because they help businesses move faster by fixing issues earlier and delivering better digital experiences!
These are six tools to diagnose, prioritize, and eliminate slowdowns—especially during scale or critical traffic surges
New Relic
Offers full-stack observability that spans frontend, backend, servers, and third-party services. It tracks transactions in real time and helps business identify performance bottlenecks buried deep in the code.
New Relic is widely used for implementing best practices for system scalability architecture, especially in microservice-based systems. Its intuitive dashboards allow developers to pinpoint load spikes, latency sources, and failed requests with minimal effort. For businesses scaling quickly, New Relic delivers clarity under pressure.
Datadog
Combines infrastructure metrics, log monitoring, and APM in one unified platform. It is one of the most trusted real-time system monitoring tools among DevOps businesses working in cloud-native or containerized environments.
Datadog enables businesses to visualize bottlenecks across the full stack and set actionable alerts on error rates and latency. Its ability to trace slow transactions across services makes it one of the best tools to fix performance issues fast. With flexible integration options, Datadog supports businesses aiming for continuous delivery and zero-downtime deployments.
Dynatrace
Stands out for its AI-powered approach to performance monitoring, making it highly effective in identifying system bottlenecks in real-time. It automatically maps service dependencies, detects anomalies, and pinpoints root causes without manual configuration.
Dynatrace is particularly useful for businesses working on complex distributed applications and microservices. It provides deep insights into memory leaks, failed transactions, and infrastructure stress points. This tool is often chosen by enterprises and software product engineering companies needing predictive diagnostics at scale.
AppDynamics
Excels at tracking slow database queries, long API response times, and memory usage across enterprise environments. It helps businesses monitor the health of applications by offering flow maps, detailed transaction data, and live performance breakdowns.
AppDynamics is one of the most effective tools for eliminating backend bottlenecks fast, especially in multi-tier applications. Its customizable alerts help reduce MTTR and improve service availability under pressure. Businesses rely on AppDynamics to detect failures proactively before users are impacted.
Prometheus + Grafana
Offer a powerful, open-source solution for businesses seeking full control over metrics collection and visualization. Prometheus handles time-series metrics, while Grafana provides interactive dashboards that show real-time system behavior.
This combination is often favored by developers looking for open-source performance monitoring tools without vendor lock-in. It works especially well for small to mid-sized business building and scaling internal platforms. Together, they allow precise detection of infrastructure slowdowns, query latency, and service saturation.
Sentry
Focuses on real-time performance issues in frontend and mobile environments, offering developers insight into crashes, rendering delays, and JS bottlenecks. It integrates tightly with modern frameworks like React, Vue, and Angular and mobile stacks such as Flutter and React Native.
Sentry acts as a lightweight performance diagnostics tool, surfacing errors with stack traces, user context, and version tracking. business use it to trace how performance impacts actual users in real-world sessions. It’s a go-to tool for product-focused business aiming to optimize the user experience quickly and efficiently.
How to Choose the Right Performance Bottleneck Monitoring Tools?
Every tech stack has its failure pointsand no single tool fits them all. Choosing the right monitoring tools starts with understanding where your application/system is most likely to slow down.
If your business prioritizes cost control, flexibility, and full access to data, open-source options like Prometheus and Grafana work best. They offer precise, low-level metrics and can be configured to match the needs of early-stage SaaS products.
📊 Matching Tools to Your Stack Type
🧱 Tech Stack Focus | 🔍 What You Need | 🛠️ Recommended Tools |
API-driven or third-party heavy apps | Monitor endpoint latency and failed requests | AppDynamics, New Relic |
Microservices / Kubernetes environments | Distributed tracing and real-time system monitoring | Datadog, Dynatrace |
Frontend or mobile-heavy products | Detect rendering lags and UI crashes | Sentry |
SQL-heavy or high-throughput databases | Query-level visibility and response time monitoring | New Relic, Prometheus + Grafana |
Cost-conscious, developer-controlled setup | Open access and customizable dashboards | Open-source performance monitoring tools like Prometheus + Grafana |
Enterprise multi-tier architecture | Automated dependency tracing, SLA tracking | Dynatrace, AppDynamics |
Business Impact of Performance Bottleneck Monitoring Tools

Tools aren’t just for detectionthey’re for growth. When companies choose the right bottleneck monitoring tools, they fix more than code. They prevent downtime, improve customer satisfaction, and reduce churn.
In fast-moving environments, even a small performance issue can delay product launches, break user flows, or trigger costly rollbacks. But when your systems are monitored properly, your business stops reacting and starts predicting. That’s the shift from surviving incidents to delivering stability.
Let’s look at how companies benefit after implementing effective monitoring tools:
A recent Forrester report noted that companies using advanced application performance optimization tools saw a 43% reduction in downtime and a 67% improvement in release velocity. These aren’t small winsthey’re operational breakthroughs!
For any software product engineering company managing SLAs, uptime, and client-facing products, the right tech stack means reputation protection and cost savings. It also builds developer confidence because when performance is predictable, business productivity improves.
Bottomline
System crashes and slowdowns don’t just happen during peak trafficthey happen when you don’t see them coming. Without the right performance bottleneck monitoring tools, you’re unable to detect the delays users face, the inefficiencies in your APIs, and the exact root causes that quietly kill your product experience!
Monitoring tools give your business the ability to spot memory leaks, resolve API latency, and prevent backend saturation before users notice. When chosen correctly, they improve deploy confidence, reduce support load, and create space for innovation instead of reactivity. In the end, it’s not just about performance’s about building trust at scale, and protecting your product from failure as it grows!
Future-Proof Your Product with Monitoring-First Architecture!
High-traffic systems need visibility at every layerfrom backend to frontend to APIs. Acquaint Softtech’s business sets up real-time monitoring, alerting, and diagnostics that scale with your business growth.
FAQ: Best Performance Bottleneck Monitoring Tools Developers Trust
-
Why are performance bottleneck monitoring tools important for product success?
These monitoring tools help businesses detect slowdowns in real time and resolve them before they affect users. From APIs to backend queries, these tools expose hidden system inefficiencies. They reduce downtime, improve deployment confidence, and ensure consistent user experiences.
-
How do I know which monitoring tool suits my tech stack?
Start by identifying where your application is most likely to slow downAPIs, databases, frontend, or infrastructure. Then, look for tools that offer visibility in those layers, such as Datadog for distributed systems or Sentry for frontend performance. You need to match the tool to your scale, business workflow, and monitoring goals. Talk with a software expert for more details!
-
Can Acquaint Softtech help integrate performance monitoring tools?
Yes, our product engineering team at Acquaint Softtech specializes in selecting and setting up the right system monitoring tools for your product. We tailor each setup to your architecturewhether you’re using microservices, legacy systems, or hybrid infrastructure. From tool selection to alert configuration and dashboard implementation, we ensure your business is fully equipped for performance visibility.
Table of Contents
Get Started with Acquaint Softtech
- 13+ Years Delivering Software Excellence
- 1300+ Projects Delivered With Precision
- Official Laravel & Laravel News Partner
- Official Statamic Partner
